Macrosystems Explorer Application
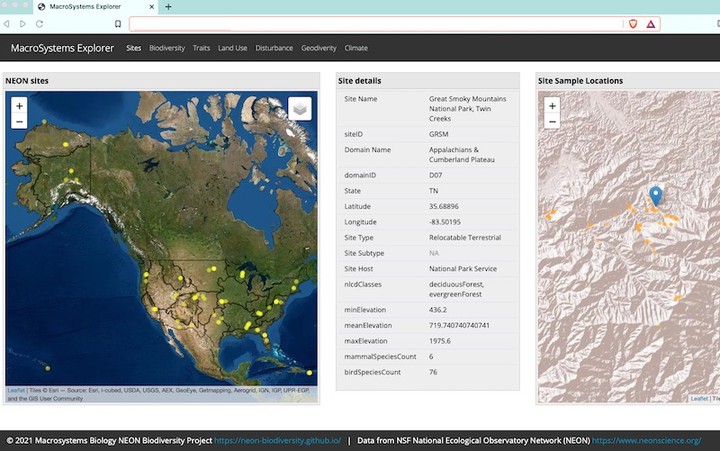
Understanding and predicting biodiversity in space and time is complex. To aid in visualizing the patterns of biodiversity and the drivers of biodiversity at different scales, we created a Shiny App featuring the United States’ National Ecological Observatory Network’s (NEON) biodiversity, derived from NEON organismal data including birds, plants, fish, ground beetles, small mammals, and zooplankton. Also included are background range maps from the IUCN (for small mammals), BirdLife International (for birds), Little’s Tree Atlas (for trees).
Each page contains different biotic and abiotic themes to explore the different dimensions of biodiversity across taxonomic groups, and the drivers of biodiversity. This goal of our web application is to provide a means to explore data generated by our sub-projects as they come available, including 30-m disturbance attributes, NEON site current and past land use, and geodiversity.
The application is in early stages of development. A preview will be made available in August 2021 so check back here for a link to the application.